
[ Energy monitoring and efficiency platform ]
Measure your energy, analyse it, turn it into proven savings.
Enverio is an energy management platform that collects minute-level data from the meters, analysers and machine controllers on your site, and turns it into consumption, power quality and efficiency analysis. From homes to heavy industry, from a single plant to several hundred branches, on the same infrastructure.
An energy bill shows the total, never the reason.
On most sites the utilities run on a single meter, often unmeasured entirely. The figure that arrives at month end will not tell you what actually cost the money: a leak, a set pressure that is too high, a machine idling, or simply more production.
While that question stays open, efficiency spending rests on guesswork, and guesswork either stops the investment or aims it at the wrong place. We take the answer from measurement.
Same month, two views
illustrative splitWhat the bill shows
What measurement shows
The out-of-hours share is a real site’s measurement; the rest is illustrative.
Platform
One panel, live.
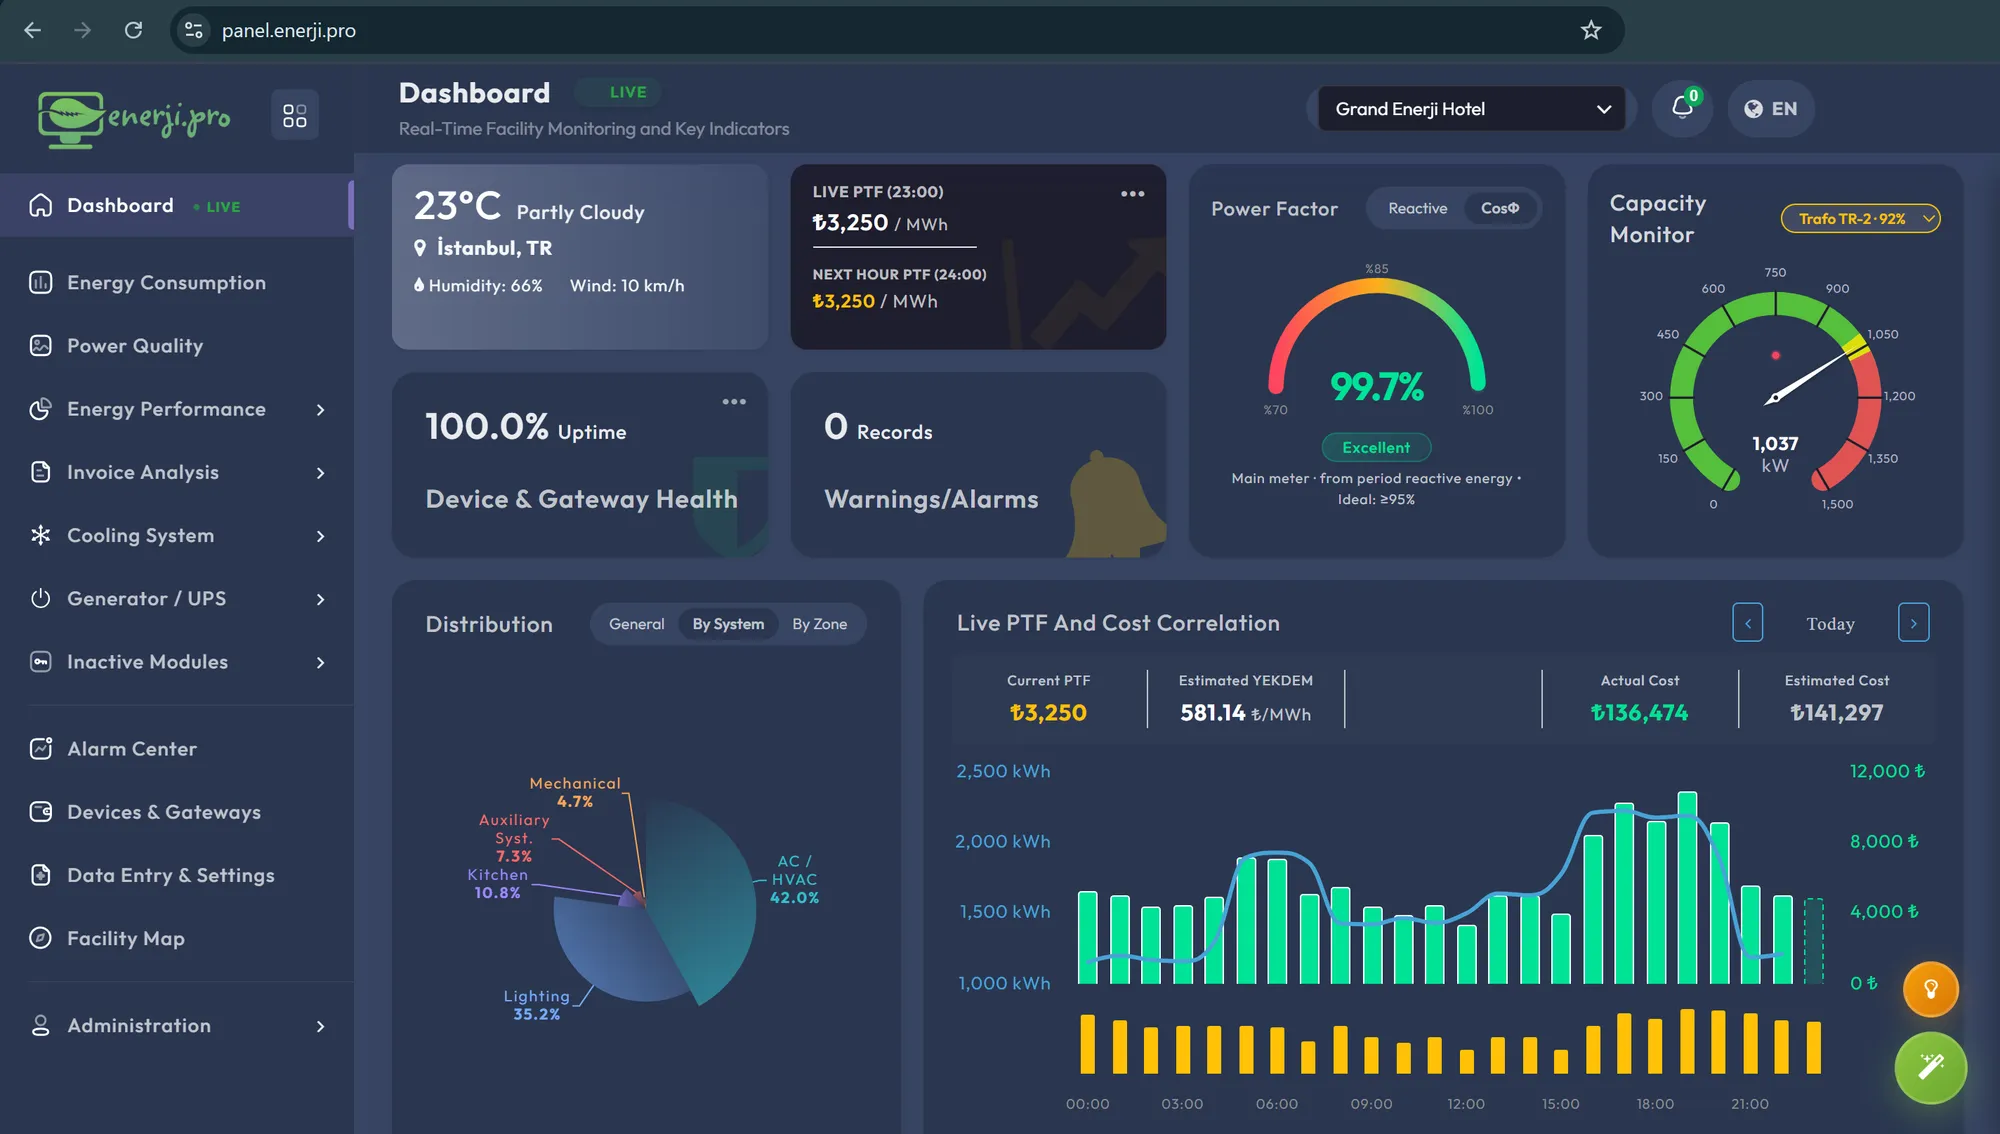
Every card below is a real component of the platform, redrawn, not screenshotted.
Live Power Flow LIVE
grid → substation → system → machineEvery kilowatt entering from the grid, through which substation, to which system: ribbon width is share, the flow is live measurement. Leakage, idling and out-of-hours load show up here at first glance.
Live monitoring
See your consumption minute by minute
Power draw across all your sites on one screen. The system spots losses, out-of-hours waste and hidden faults before the bill does.
- Minute-level power and consumption analysis
- Out-of-hours waste and anomaly detection
- Cost breakdown by site, area and machine
Consumption and Cost LIVE
HourlyDailyschematic
Reactive management
See the reactive penalty before it exists
Inductive and capacitive trends are audited around the clock; failing compensation stages are reported long before the limit is breached.
- Live ratios showing distance to the penalty limit
- Faulty or missing capacitor stage detection
- Cos φ analysis for operating efficiency
Reactive Status
mid-month · day 14/28The ratio reaches 14.8% on the day shift. Schedule a compensation stage check before the penalty limit.
Bill analysis
Validate the bill before paying it
Do not overpay because of tariff mix-ups or wrong network charges. The platform recalculates your bill independently and finds the difference line by line.
- Automatic recalculation from half-hourly data
- Wrong tariff, wrong supply class and off-contract line detection
- Line-by-line dispute records for supplier talks
Bill Validation
line by line- Energy charge half-hourly price × consumption£41,698.86 ✓ Matched
- Network (DUoS) published tariff£6,204.31 ✓ Matched
- Excess capacity not due under agreed capacity£2,317.40 +£2,317.40 diff
- Climate Change Levy correct base£3,201.66 ✓ Matched
Overpayment found £2,317.40
It starts with electricity. It does not end there.
Every module runs on the same measurement layer. Alongside every electrical parameter, the other quantities on site are watched on the same panel.
Data stays on our own infrastructure. There is no dependency on equipment vendors’ cloud services, and if you remove the installation your history stays with you.
- Power · kW
- Pressure · bar
- Flow · m³/h
- Temperature · °C
- Consumption
- Power
- Demand
- Reactive
- Voltage
- Current
- Power factor
- Harmonics
- Imbalance
- Frequency
- Natural gasm³
- Waterm³
- Temperature · Humidity°C · %RH
- Pressure · Flowbar · m³/h
- Heat meteringkWh
- Fuel levelL · %
Alerting
Hear about the problem before the bill does
No dashboard vigils. Anomalies, demand spikes and reactive drift reach you and your team by email the moment they happen.
- Windowed thresholds per shift and day type
- Dead band and hysteresis keep alarms worth reading
- Event history doubles as maintenance evidence
Alerts and reporting
last 24 hours- Inductive ratio approaching warning limit 14:32
- Weekly generator test passed 11:05
- TR-2 analyser communication lost 09:47
AI assistant
Ask your data a question, get a sourced answer
Enver reads your own site data. Every answer lists the data it rests on; without a source it does not answer.
- Plain-language questions, answers from your data
- Rule-based audit: deterministic recommendation cards
- No data, no guess, it says "we do not measure this"
AI assistant
Enver-
Why was Saturday consumption high?
- Enver
The compressor line stayed loaded all day with no production logged, 81% above the usual Saturday level.
- hourly consumption
- site calendar
Consumption forecasting
Know the expected consumption in advance
The system learns your site’s production–consumption relationship by regression and computes each month’s expected consumption up front. When actuals drift from the forecast, the gap is flagged as a percentage, a production dip never masquerades as efficiency.
- A forecast model built on production (the baseline, EnB)
- Actual − forecast deviation watched against a threshold monthly
- Audit-ready records for ISO 50001
Consumption Forecast
Forecast modelDeviationsschematic
Personalisation
Build your own dashboard
The chart cards from the consumption and quality screens flow past in a strip; pick the one you want and drop it onto your own dashboard. Everyone sees the screen that matches their job.
- Every card on the consumption and quality pages is selectable
- Drag-and-drop layout, no settings screen, no code, no ticket
- Layouts are saved per user; everyone’s dashboard is their own
Dashboard Layout
drag & drop1,212kW
97.7%
1,964kWh
26°C
13.5%
3
Same data, different questions.
- Energy Consumption Analysis Which feeder, which hour, and at what cost? →
- Power Quality Monitoring Is our network carrying charge and failure risk? →
- Energy Performance & ISO 50001 Consumption changed, saving, or a production effect? →
- Electricity Bill Validation Is the bill that arrived this month actually right? →
- Compressed Air and Compressor Monitoring What is compressed air actually costing us, and how much of it is leaking away? →
- Chiller and Cooling System Monitoring How efficiently did the cooling plant actually run today? →
- Generator and Standby Power Monitoring If the power failed right now, would the generator take the load? →
- AI Assistant: Enver If you could ask your data one question, what would it be? →
- Remote Control and Scheduling Can I switch off what I can see, from the same screen? →
- Solar Monitoring Generation, inverter performance and half-hourly netting. Coming soon
- Carbon Footprint Scope 1-2-3 accounting from the same measurement layer. Coming soon
- Water Management Consumption, leakage and recovery monitoring. Coming soon
- Boilers and Steam Efficiency, condensate return and the cost of steam. Coming soon
- Heat Pumps COP, source temperature and seasonal performance. Coming soon
Product video
Enverio in two minutes
From measurement to the bill, from leakage to proven savings: the whole platform in a short walkthrough.
Watch the 6-minute full walkthrough →Turkish narration for now; the English edit is on its way.
From homes to heavy industry.
The measurement layer is the same; what changes is the question you are asking. In every sector a different line turns out to be the largest on the bill.
- Residential Shared areas in estates and apartment blocks, apportioned by supply.
- Retail Stores, supermarkets and bank branches. Hundreds of sites on one platform, with benchmarking and outlier detection.
- Commercial buildings Shopping centres, hotels, hospitals, offices. Cooling and tenant apportionment lead.
- Public sector Municipal and institutional buildings, with ISO 50001 and reporting obligations.
- Logistics Warehousing and cold chain; refrigeration continuity and generator readiness.
- Industry Compressed air, steam, process cooling. Consumption normalised against production volume.
Measuring on its own is not enough.
Plenty of systems collect data from the floor. The difference lies in whether that data ever becomes a judgement. Without all four steps, monitoring is an expensive chart on a screen.
- 01
Measure
Power analysers, transmitters and machine controllers are read every minute. A site gateway carries the data to the platform, no extra PC or local server required.
- 02
Derive
A raw reading means little on its own. Specific energy, COP, leak rate and the expected invoice are all calculated at this layer.
- 03
Compare
Each derived value is held against a reference: the machine’s datasheet curve, the site’s own history, or the line items on the invoice that arrived. A number without a reference decides nothing.
- 04
Alert and report
When a deviation clears the threshold an alarm opens and an email goes out. Monthly reports are built on the same calculation, what you read in the report comes from the same source as what you see on screen.
Every figure is shown with its provenance: measured, derived or estimated. The three are never presented as equivalent.
Verified saving
One ice cream plant, 614 days.
The compressor house was renewed, the set pressure lowered, heat recovery brought online. The figures below are the consumption avoided over that period, measured against a reference period and calculated phase by phase.
-
1,361,823
kWh · Consumption avoided
-
40
% · Below the reference, current phase
-
4.09
yrs · Payback period
The calculation is kept open. The reference period is real meter data; the final phase’s monthly consumption was not measured but derived from the pressure difference, and is labelled "derived" in the platform. The payback period is calculated without incentives, the investment incentives actually used were left out, and including them would shorten it. Heat recovery assumes all recovered heat was used; that is the programme’s one optimistic assumption, and the platform says so too.
Let us measure what is happening on your site.
In a one-hour call we look at your existing setup and set out exactly which measurement points are needed and what you would be able to see.